A ShakeMap shows the ground shaking that can be expected by an earthquake at every point in Switzerland. The data recorded by real-time seismometers is transmitted to the Swiss Seismological Service in Zurich. There, the data is analyzed and following an earthquake, a ShakeMap is created within approximately five minutes.
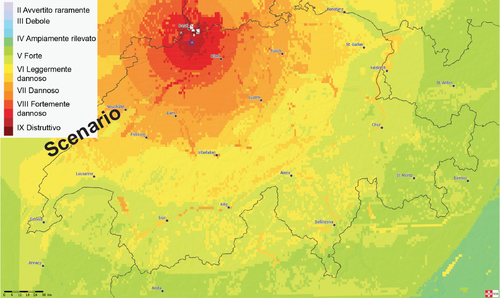
The ShakeMap for the scenario earthquake near Basel with a magnitude of 6.6 is shown below. A similar earthquake occurred at the same location on October 18, 1356, resulting in enormous damage. On average, a comparable earthquake can be expected in the Basel region every 1,500 to 2,500 years. The star denotes the epicenter of the earthquake. The colors indicate how strong the ground shaking would be at certain locations and what possible damage would result.
The colors used in the ShakeMap are derived from the European Macroseismic Scale (EMS-98), which is used as a measure for comparing the impact of earthquakes across Europe. This scenario earthquake would reach an intensity of IX near the epicenter and cause destructive damage as well as panic among the local population.