Hazard in Comparison
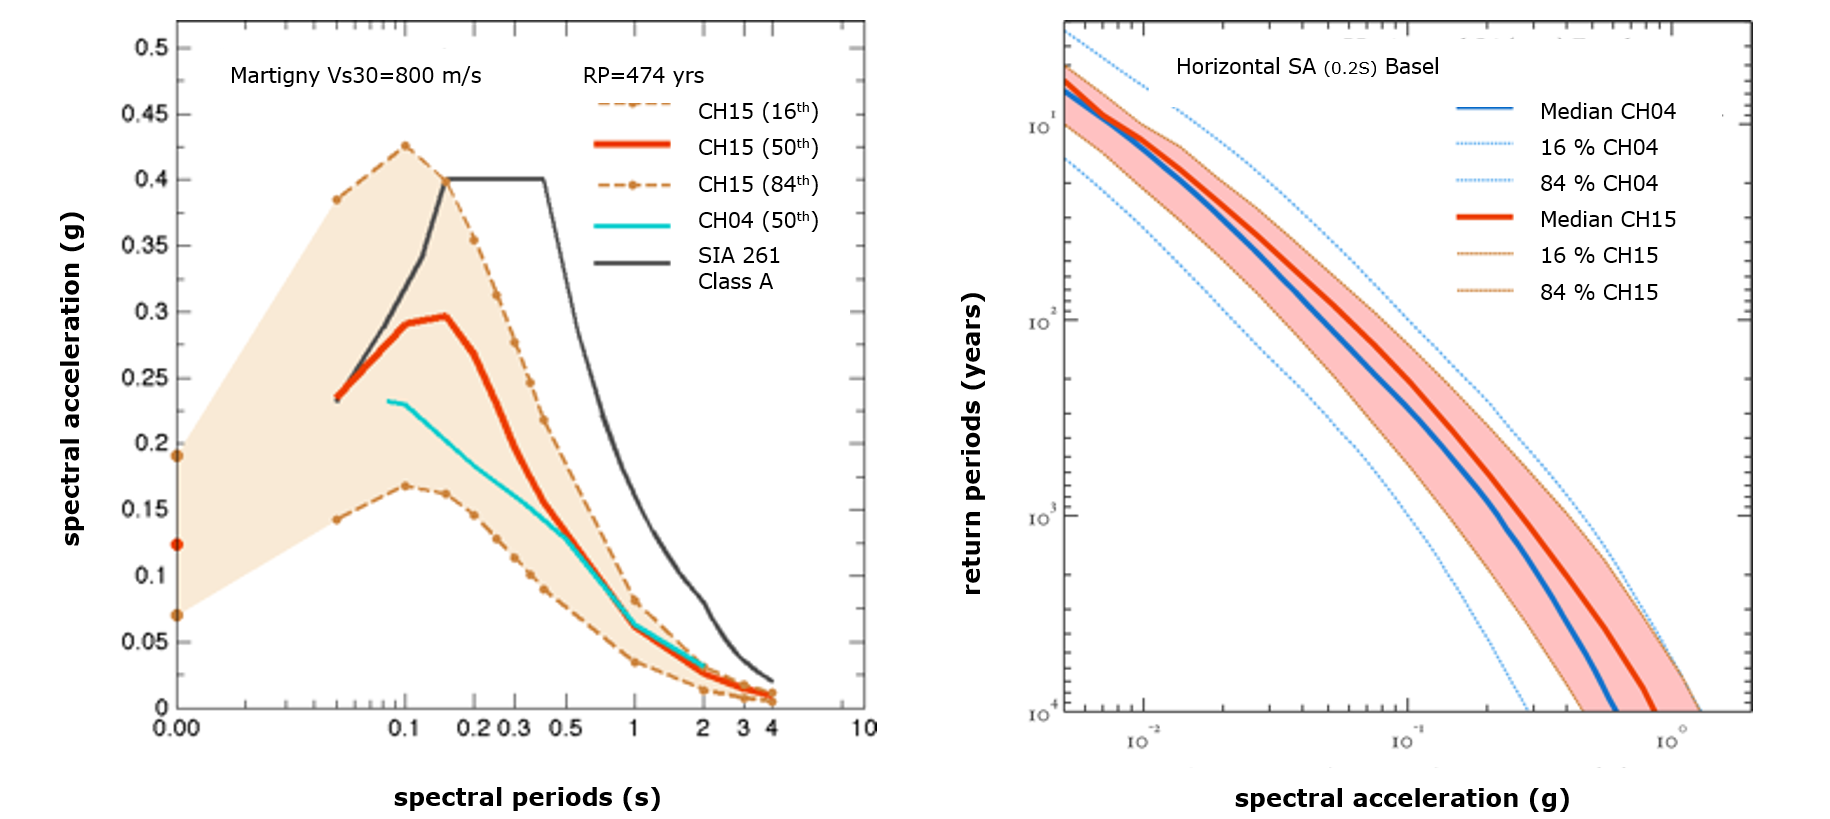
The figure on the left shows an example comparison, at Martigny, of the 2015 hazard model (CH15) with the 2004 model (CH04) for various frequencies and the SIA-defined standard spectra (SIA261).Compared with CH04, CH15 covers a wider frequency range and for certain frequencies shows somewhat higher hazard. On the right we compare the models using so-called hazard curves — the expected return periods of spectral acceleration — for Basel at a frequency of 5 Hz.