A seismogram is the electronic recording made by a seismometer of the ground movements associated with earthquakes. The resulting diagram is wave-shaped with varying amplitudes and wavelengths since the movement at a measuring station during an earthquake is non-linear (see question "What are the period, wavelength and amplitude?"). The energy released by an earthquake (magnitude) as well as the location of its hypocenter can be estimated by evaluating a large number of such diagrams.
Learn more
Realtime seismograms last 5 minutes
Realtime seismograms last 20 minutes
Realtime seismograms last 2 hours
Realtime seismograms last 24 hours
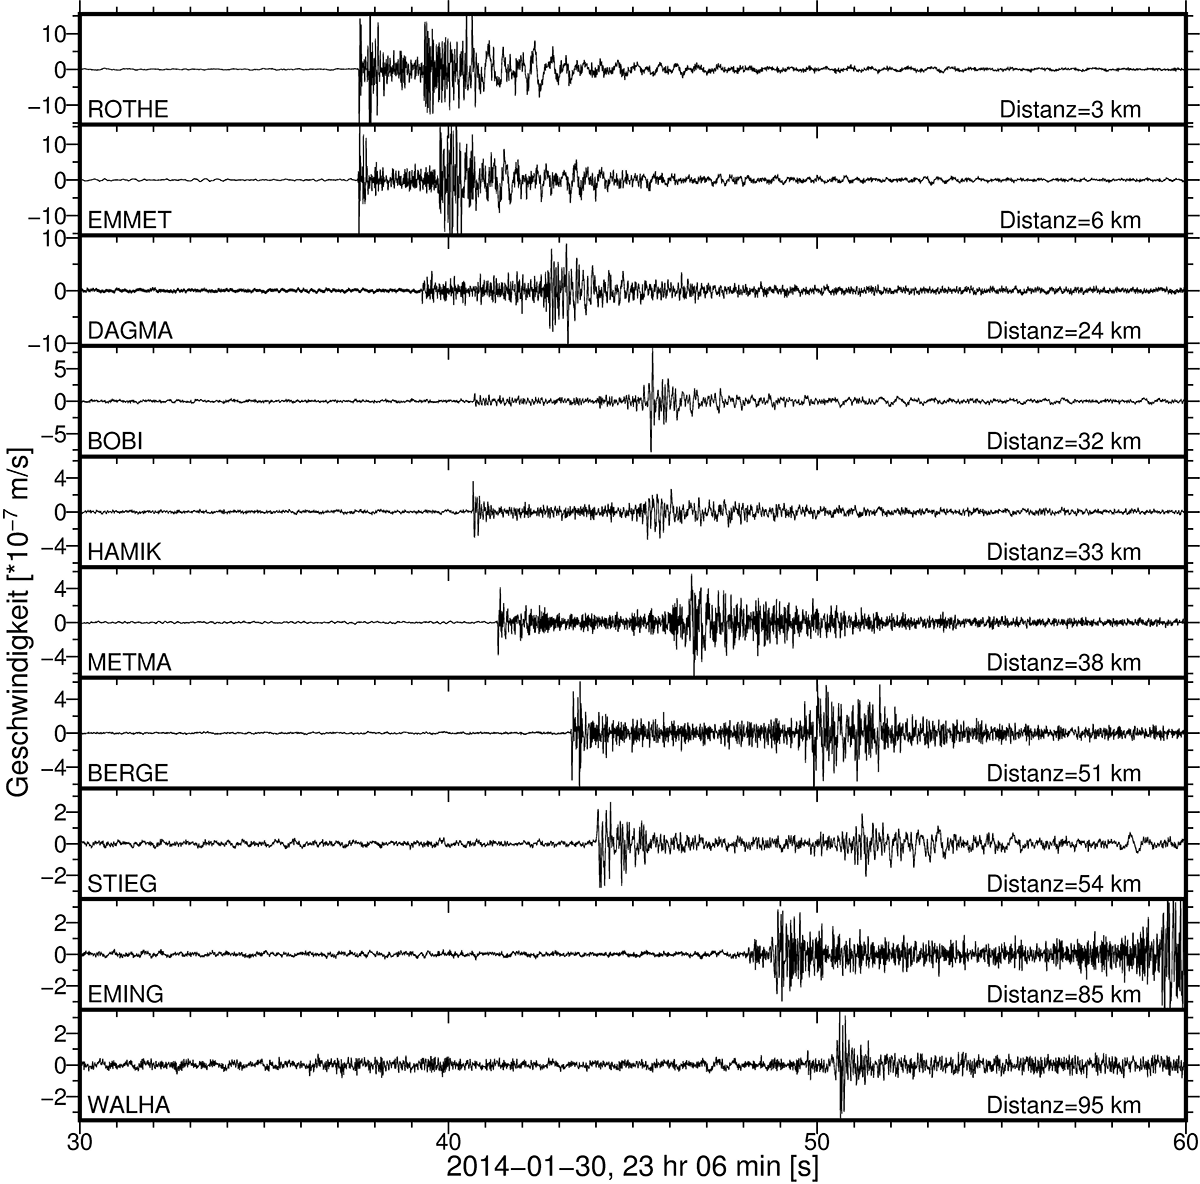
Seismograms of the earthquake on 30 January 2014 near Gelterkinden in the canton of Basel-Landschaft