Explore our interactive maps to learn about current and past seismic activity and combine them with other relevant information, on earthquake hazard for example.
To find out more about a specific Swiss earthquake, click on the link to that earthquake on the homepage or on this website. Then click on the map to access the required information in the interactive view.
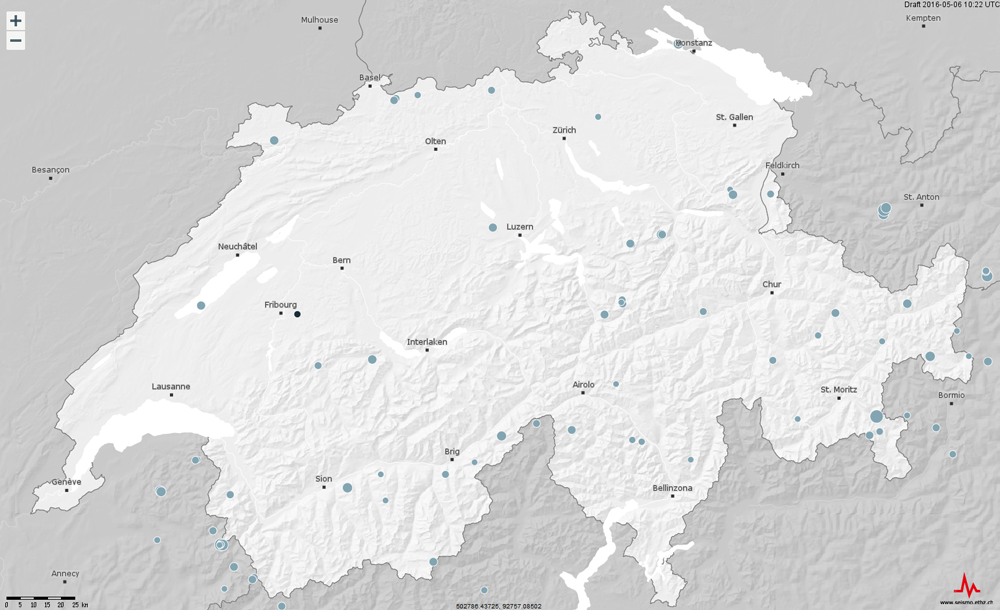
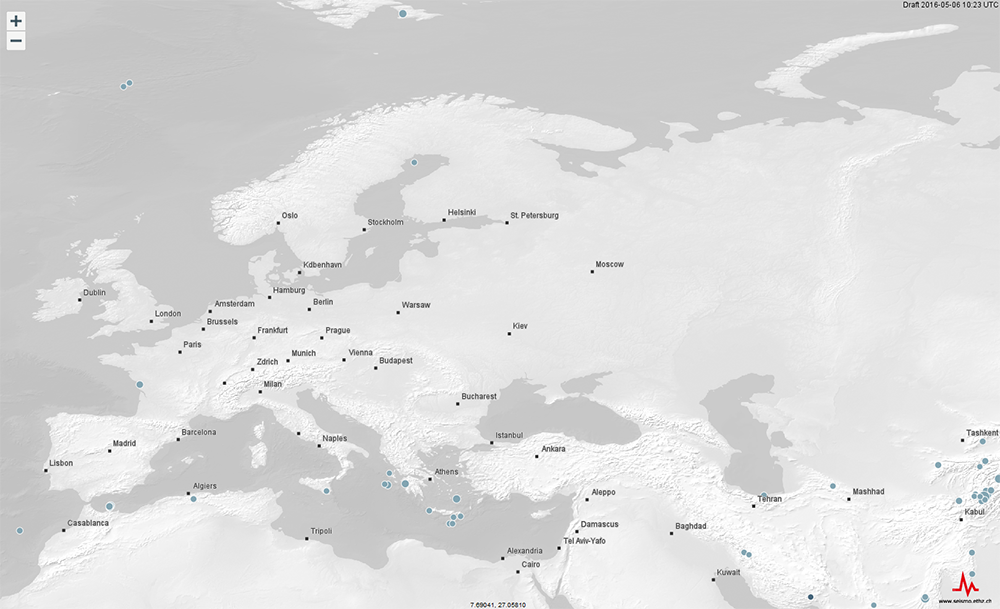
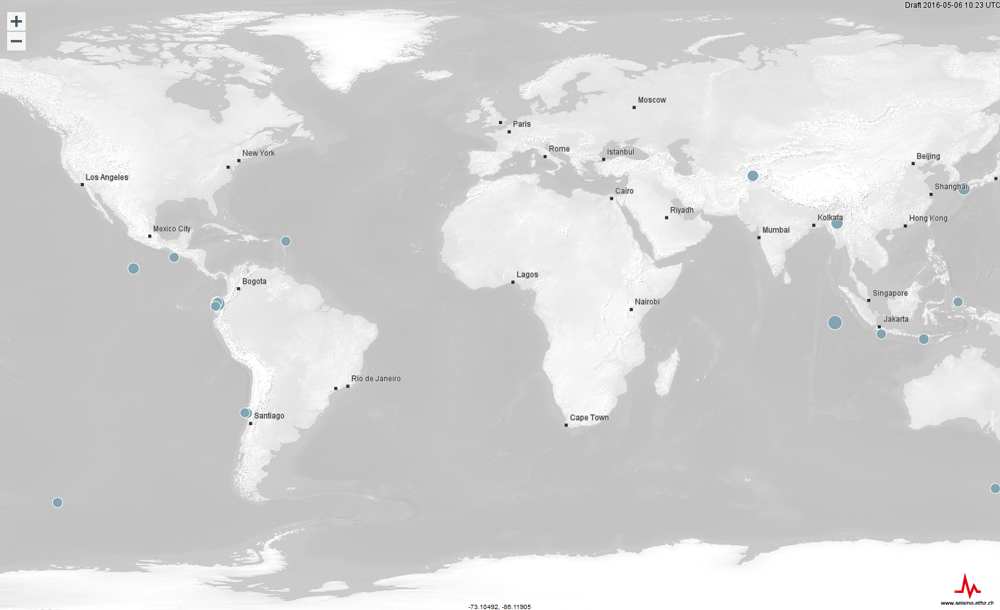
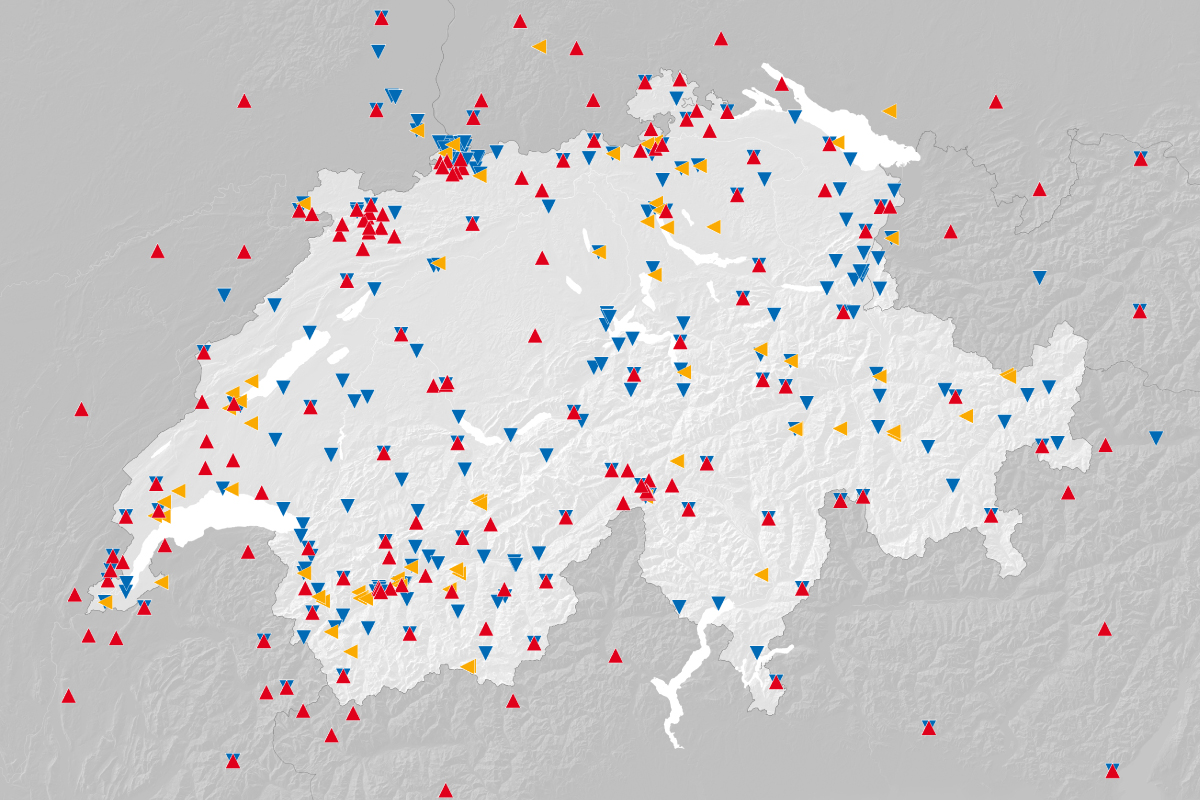
Earthquake maps
Seismic monitoring network
Earthquake hazard and risk maps
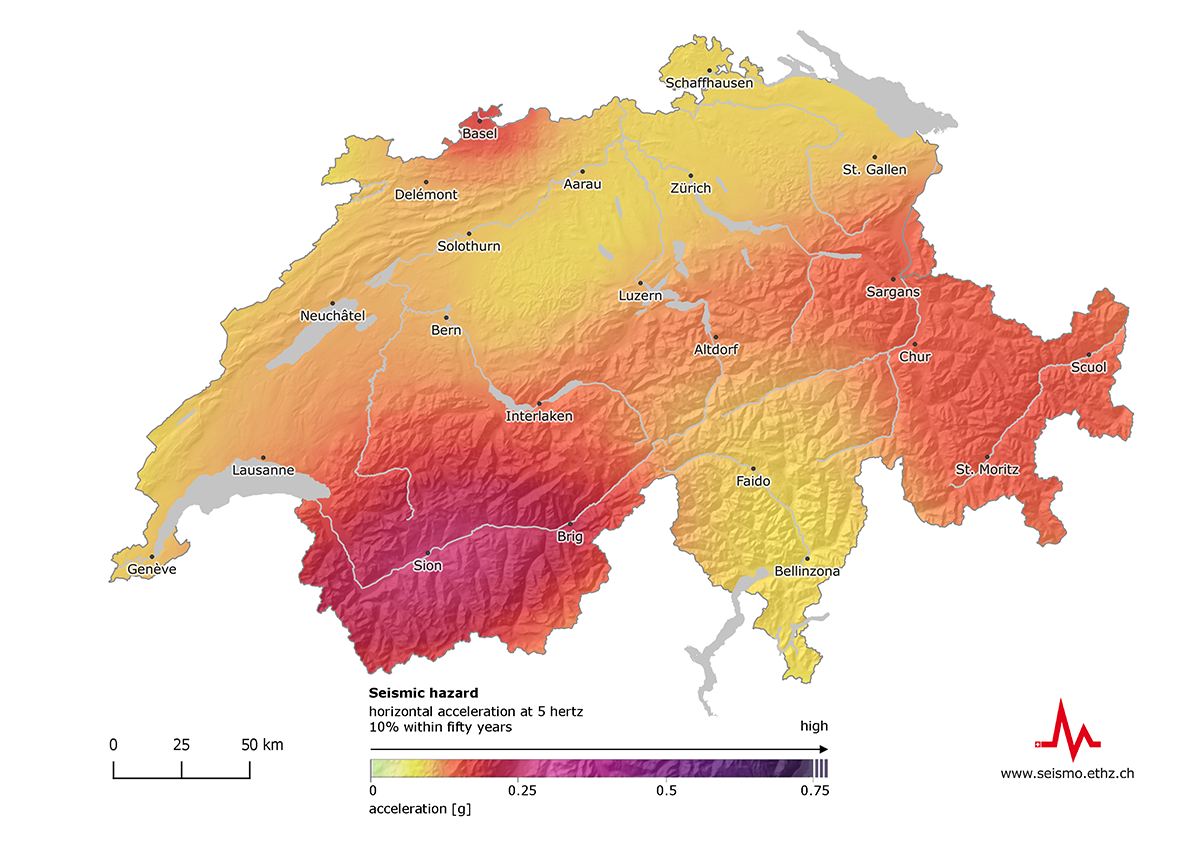
Earthquake hazard in Switzerland
The earthquake hazard map shows the expected horizontal acceleration caused by earthquakes within a certain period at a specific location.
Earthquake risk in Switzerland
The earthquake risk map is based on an index that combines the expected number of fatalities with the estimated financial losses due to building damage.

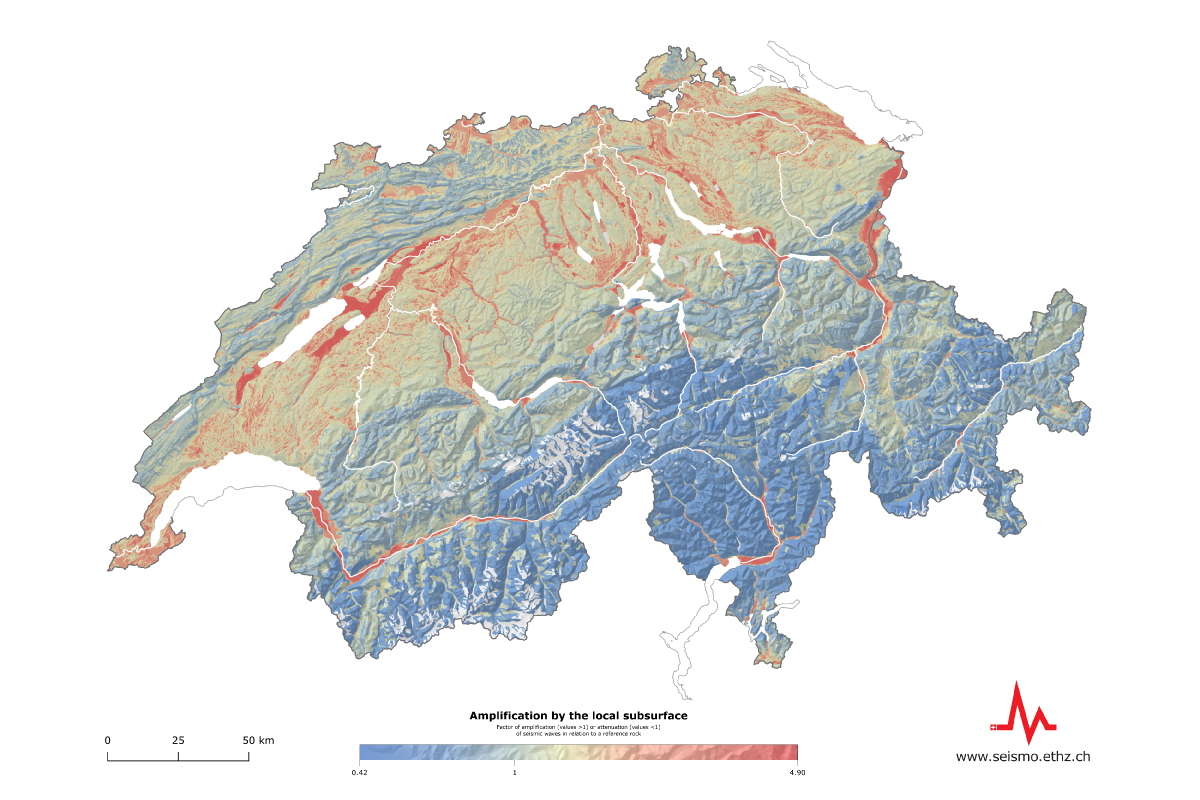
Amplification by the local subsurface
The local subsoil affects how strong the shaking from an earthquake will be at a particular location: the softer the subsoil, the more the seismic waves are amplified. This map shows the soil amplification of the seismic waves compared to a standard reference rock (with an average S-wave velocity in the shallower 30m, Vs30, of 1100 m/s): Values greater than 1 mean a higher amplification, values below mean a lower amplification.
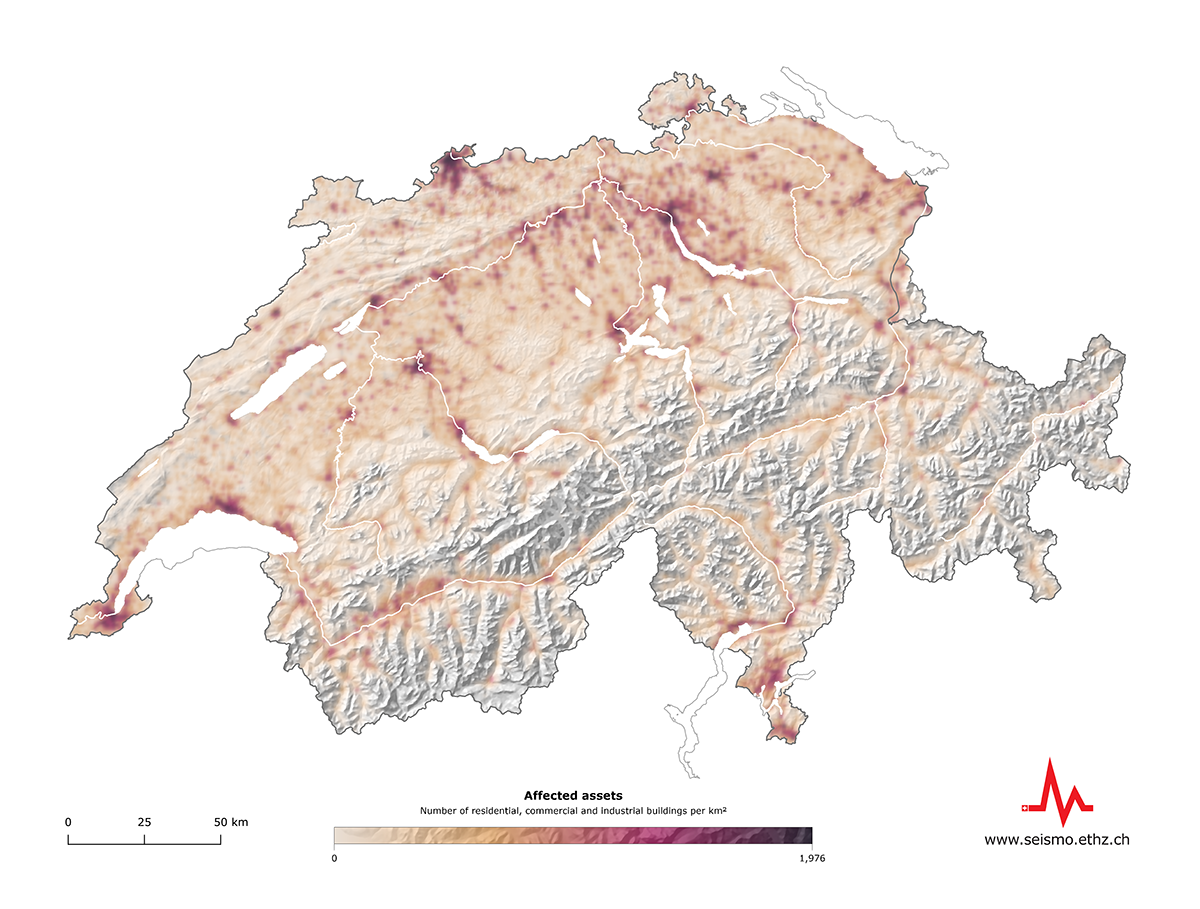
Map of people and assets affected
Earthquakes can only cause damage in places where people and property are present. The map of people and assets affected shows the spatial distribution of Switzerland's more than 2 million residential, commercial and industrial buildings.