Serguei Balassanian
(National Survey for Seismic Protection, Yerevan, Armenia), Tahmet Ashirov
(Institute of Seismology, Academy of Sciences, Ashkhabad, Turkmenistan),
Tamaz Chelidze (Institute of Geophysics, Academy of Sciences, Tbilisi,
Georgia), Arieev Gassanov (Experimental Methodical Geophysical Expedition,
Academy of Sciences, Baku, Azerbaijan), Nadia Kondorskaya (Joint Institute
of Physics of the Earth, Moscow, Russia), George Molchan (International
Institute of Earthquake Prediction Theory and Mathematical Geophysics,
Moscow, Russia), Bella Pustovitenko (Geophysics Institute, National Academy
of Sciences, Kiev, Ukraine), Vladimir Trifonov (Joint Institute of Physics
of the Earth, Moscow, Russia), Valentin Ulomov (Joint Institute of Physics
of the Earth, Moscow, Russia), Domenico Giardini (Istituto Nazionale di
Geofisica, Roma, Italy; Institute of Geophysics, ETH Zurich, Switzerland),
Mustafa Erdik (Bogazici University, Kandilli Observatory, Istanbul, Turkey),
Mohsen Ghafory-Ashtiany (International Institute of Earthquake Engineering
and Seismology, Tehran, Iran), Gottfried Gruenthal (GeoForschungs Zentrum,
Potsdam, Germany), Dieter Mayer-Rosa (Institute of Geophysics, ETH Zurich,
Switzerland), Vladimir Schenk (Institute of Rock Mechanics, Academy of
Sciences, Praha, Czech Republic) and Max Stucchi (Istituto di Ricerca sul
Rischio Sismico, Milano, Italy)
Keywords: seismic hazard assessment,
historical earthquakes, active faults, Caucasus
Abstract
The GSHAP CAUCAS test area was established
under the INTAS Ct.94-1644 (Test area for seismic hazard assessment in
the Caucasus) and NATO ARW Ct.95-1521 (Historical and prehistorical earthquakes
in the Caucasus), with initial support of IASPEI, UNESCO and ILP. The high
tectonic interest and seismicity rate of the whole area, the availability
of abundant multi-disciplinary data and the long established tradition
in hazard assessment provide a unique opportunity to test different methodologies
in a common test area and attempt to establish some consensus in the scientific
community. Starting from the same input data (historical and instrumental
seismic catalogue, lineament and homogeneous seismic source models) six
independent approaches to seismic hazard assessment have been used, ranging
from pure historical deterministic to seismotectonic probabilistic to areal
assessment methodologies. The results are here compared.
Introduction
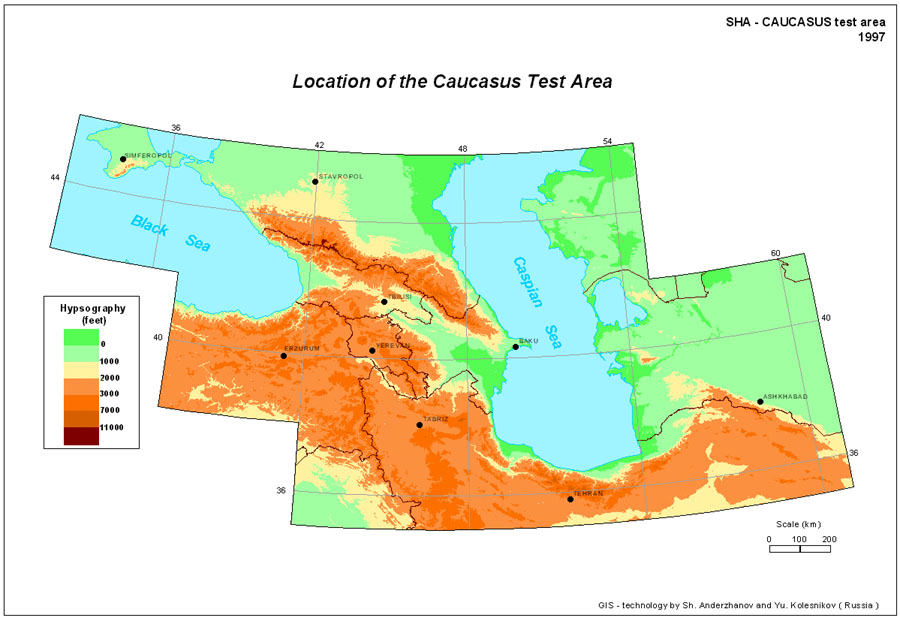
The Caucasus is one of the most active segments of the Alpine-Himalayan seismic belt and marks the junction between the African, Arabian and Indian plates to the South, and Eurasian continent to the North (Figure 1). Vulnerability to disaster is increasing in the Caucasus as urbanization and developments occupy more areas that are prone to the effects of significant earthquakes, as demonstrated in the last few years by the devastating earthquakes in Turkey, 1976 and 1983, Armenia, 1988, Iran, 1990 and 1997, Georgia, 1991, Turkey and Georgia, 1992.
The Caucasus is considered as a key area for seismic hazard assessment by the whole geophysical community; IASPEI, ESC and GSHAP have agreed to concentrate efforts in the Caucasus in the 1994-97 period for the following reasons:
The GSHAP CAUCAS test area was established with initial support of IASPEI, UNESCO and ILP; the INTAS Ct.94-1644 (Test area for seismic hazard assessment in the Caucasus) and NATO ARW Ct.95-1521 (Historical and pre-historic earthquakes in the Caucasus; Giardini and Balassanian, 1997) provided the needed resources to carry out the work, with the participation of specialists from Caucasus countries and from Western Europe: Armenia (National Survey for Seismic Protection of RA, NSSP, Yerevan), Georgia (Institute of Geophysics, Georgian Academy of Sciences, IG/GAS Tbilisi), Azerbaijan (Experimental Methodical Geophysical Expedition of the Azerbaijan Academy of Sciences, EMGE, Baku), Iran (International Institute of Earthquake Engineering and Seismology, IIEES, Tehran), Turkey (Bogazici University, Kandilli Observatory, BUKO; Earthquake Research Institute, ERI, Istanbul), Russia (Joint Institute of Physics of the Earth, JIPE; International Institute of Earthquake Prediction Theory and Mathematical Geophysics, MITPAN, Moscow), Ukraine (Geophysics Institute, National Academy of Sciences of Ukraine, IG/NAS, Kiev), Turkmenistan (Institute of Seismology, Turkmenistan Academy of Sciences, IS/TAS, Ashkhabad), Italy (Istituto Nazionale di Geofisica, ING, Rome), Germany (GeoForschung Zentrum, GFZ, Potsdam), Switzerland (ETH, Institute of Geophysics, IG/ETHZ, Zurich)
The work was conducted in close coordination
and with the technical support of the GSHAP Regional Center at UIPE, Moscow;
more details on the hazard assessment for the whole area are given by Ulomov
(1999). Four main tasks were identified and carried out by working groups,
formed by specialists from the Caucasus, Iran, Turkey, FSU and Western
Europe: (A) Earthquake Catalogue and Data base; (B) Seismic Source Zoning;
(C) Strong Seismic Ground Motion; (D) Seismic Hazard Mapping. The Steering
Committee of the Caucasus test area met six times, to evaluate progress
and planning, in Ashkhabad, 10/94; Tehran, 5/95; Boulder, 7/95; Erice,
10/95; Yerevan, 7/96; Tbilisi, 7/97.
Earthquake catalogue and data
base
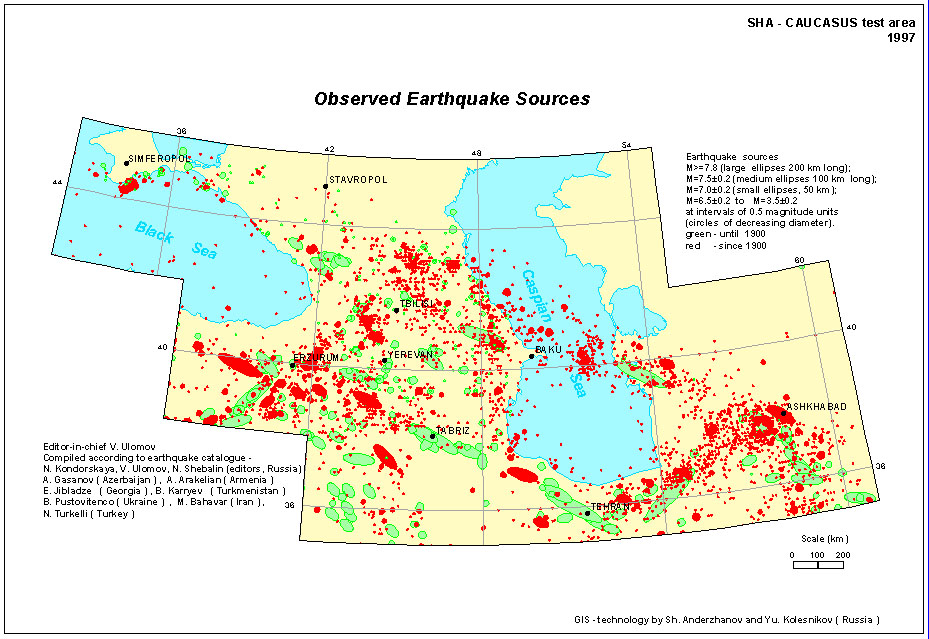
Under the leadership of N. Kondorskaya at JIPE, Moscow, the Special Catalogue of Earthquakes for the CAUCAS Test Area (SCETAC) was compiled by the Working Group on Catalogue. The epicentral map is shown in Figure 3. The Catalogue covers three time periods:
The following main parameters are listed by SCETAC: origin time, epicentre co-ordinates, depth, magnitude, epicentral intensity. Each parameter is followed by its reference number and a descriptor which indicates the parameter determination method. The catalogue also contains identifiers of event type and earthquake associated phenomena, as well as Flinn-Engdahl region and country code number.
Two type of magnitudes are used in SCETAC: the conventional magnitude (M) and the moment magnitude (Mw). The conventional magnitude for larger events has been determined using surface waves and the Prague formula (Karnic et al., 1962); M=Ms for Ms³ 5.3. For smaller magnitudes, was calculated on the basis of K energetic classes, using the correlation function between M and K by Rautian (1960): M = 0.55 K - 2.2. The moment magnitude was computed with the equation of Hanks and Kanamori (1997): Mw = 2/3 log Mo - 10.7. The direct assessment of the seismic moment has been made using P wave spectra as well as from the centroid moment tensors from Harvard University.
In the compilation
of SCETAC, aftershocks and foreshocks were identified and purged in the
magnitude range M=2.08.0 using a computer programme of which the main
algorithms are:
Seismic source zoning
Under the leadership of V. Ulomov at JIPE, Moscow, the preparation of all geophysical/geological input materials in digital form and of maps of seismic sources, active faults and lineament seismic source model were completed.
For the identification
of seismogenic features and for the assessment of their seismic potential,
it is essential to map earthquake sources in accordance with their dimension
and orientation rather than as simple point-sources. These parameters are
determined from several data sets: aftershock distribution, surface ruptures,
higher intensity isoseismals, earthquake mechanisms, geodetic measurements,
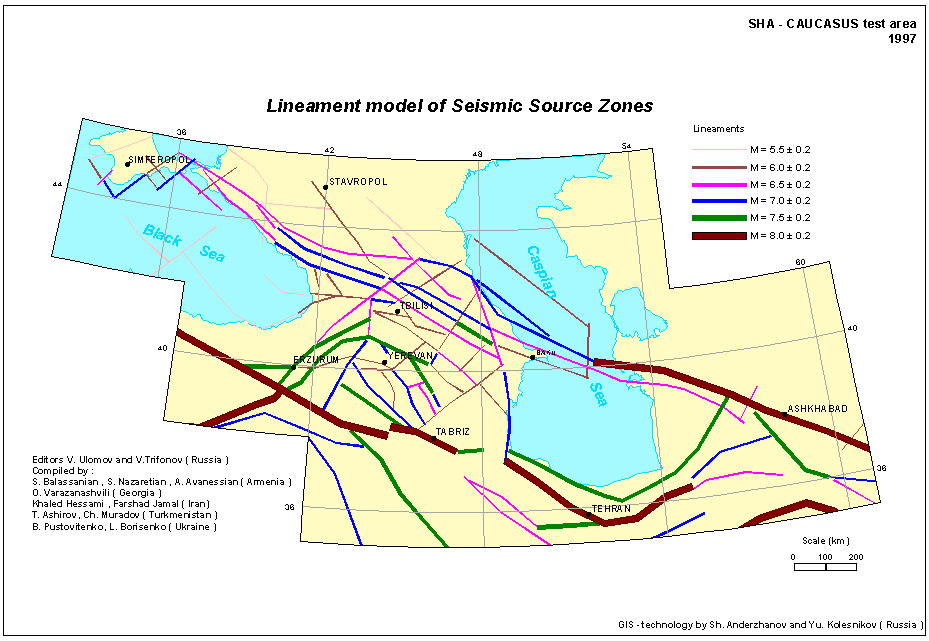
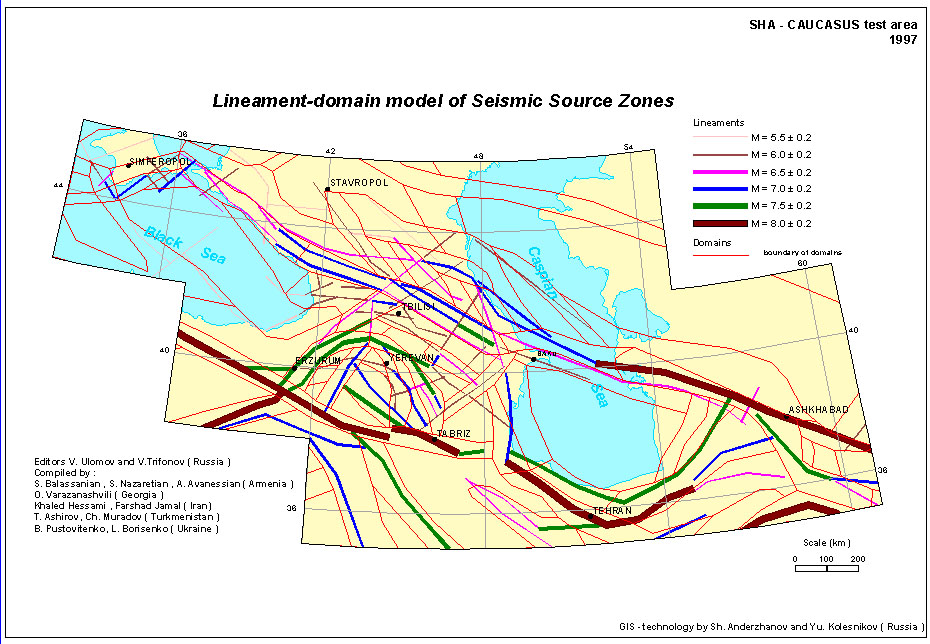
tectonic analyses, etc. The lineament model of Seismic Source Zones was
compiled by the Working Group on Seismic Source Zoning in 1996 and is shown
in Figure 4. The thickness of the lines decreases twice with each step
of reduction of the magnitude value. The value of maximum potential magnitude
for each lineament (Mmax) is estimated from the dimensions of paleo-ruptures,
archaeological and historical remains, the width of zones of dynamic influence
of seismogenetic features, the lengths of seismogenic faults and lineaments,
the dimensions of interacting geoblocks, the location of bends in recurrence
curves, extreme values in the plot of accumulated strain in earthquake-generating
features. Lineament source zones are classified, similarly to earthquakes,
according to the following magnitude groups (Ms or Mw): M£ 8.0±
0.2; £ 7.5± 0.2; £ 7.0± 0.2; £ 6.5±
0.2; £ 6.0± 0.2; £ 5.5± 0.2.
Multi-method Seismic
Hazard Assessment
Following the IASPEI and GSHAP recommendations for the CAUCAS Test Area, seismic hazard assessment was compiled using a number of different techniques and starting with the same earthquake catalogue (SCETAC) and lineament source model. Six different generations of hazard hazard mapping were implemented by four independent groups:
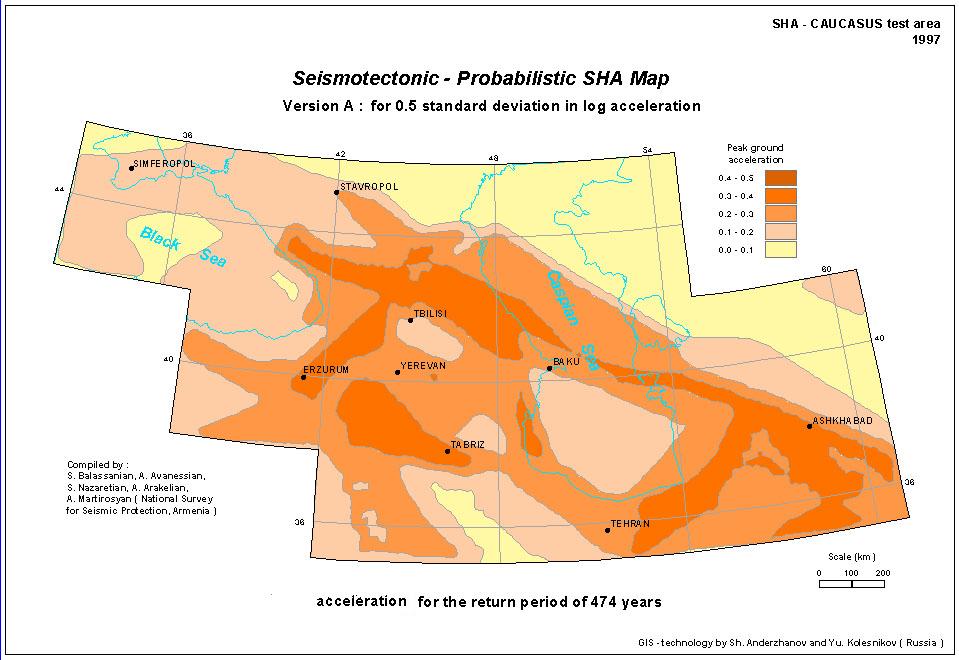
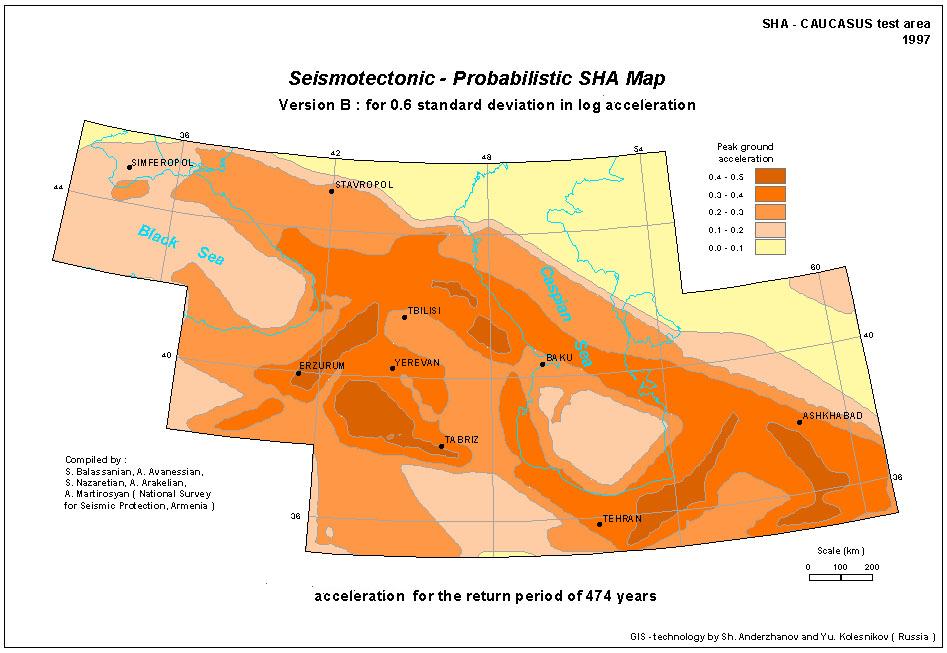
This mapping was implemented by S. Balassanian, A. Martirosyan, A. Avanessian, S. Nazaretian, A. Arakelian, under the leadership of S. Balassanian. On the basis of the Lineament model of SSZs the areal Seismic Source Zones Model is composed for probabilistic assessment of seismic hazard. This model consists of zones, each of which either traces active faults or represents an area with diffusely distributed seismicity. Maximum magnitudes of SSZs are mainly defined by magnitude of a corresponding seismotectonic structure, varying within its uncertainty depending on the magnitude of the strongest earthquake of that zone. Using spatial interpolation and smoothing procedure, a map of mean hypocentral depths is compiled and all the zones are divided into three groups with mean depth of 10,15 and 20 km. The Ground Motion Attenuation model of Joyner and Boore (1993), used before for seismic hazard computations in Armenia, has been adopted. Calculation of accelerations was done using SEISRISK III by Bender and Perkins (1987), using only the areal homogeneous source zone model. Two seismic hazard maps for the reference 475 years return period and for log standard deviation 0.5 and 0.6 were computed, displayed in Figures 5 and 6.
2. Seismic Hazard Assessment: Deterministic-Probabilistic approach (JIPE, Russia)
This mapping was implemented by V. Ulomov, A. Gusev, V. Pavlov, L. Shumilina and N. Medvedeva under the leadership of V. Ulomov. The methodology for seismic hazard assessment is based on the concept of structural-dynamic unity of the medium and on a deterministic-probabilistic approach to hazard assessment. This methodology includes 3-dimensional source zones and adequately reflects the nature of seismicity. The authors consider four structural levels of Seismic Source Zones; the main structural unit of global seismicity is the region, which includes then three types of seismic structure; lineaments, domains and potential earthquake sources. All these features are the main components of the Lineament-Domain-Focal model (LDF-model) (Figure 7). The "Intensity-distance-magnitude" relationship is simulated using a simple theoretical model calibrated using observed macroseismic data from the test area; at regional distances, it coincides with the average I(r,MLH) relationships after Shebalin, derived for the Caucasus and for the whole Eurasia; in the vicinity of the source, instead, the Blake-Shebalin formula overestimates intensity. The model we adopt eliminates this inconsistency and describes the amplitude saturation around a fault. To calculate seismic hazard maps, an algorithm and software were designed, which mainly follow the common lines of Riznichenko (1965) and Cornell (1968). Two hazard versions were compiled, the first with an upper boundary of earthquake sources constant over the whole territory of the test area, located within the superficial 5km thick layer, the second with the upper boundary of earthquake sources also 5 km thick, but starting below the unconsolidated sediment layers. This version is more realistic (Figure 8).
3. Seismic Hazard Assessment: Areal-Probabilistic approach (MITPAN, Russia)
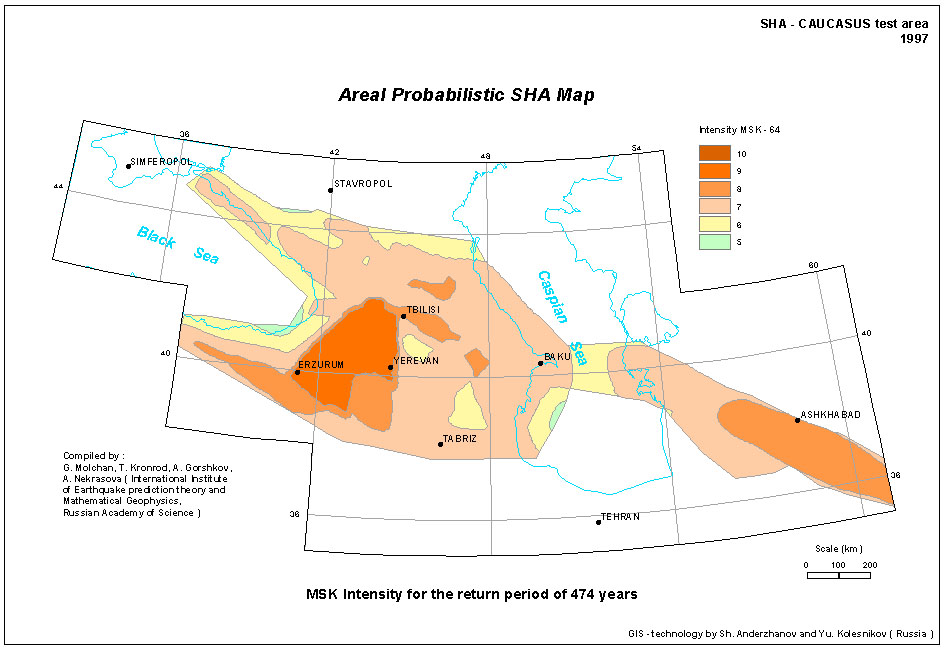
This mapping was implemented by G. Molchan, T. Kronrod, A. Gorshkov, A. Nekrasova under the leadership of G. Molchan. The Seismic Source Zones map is based on the idea of a multifractal representation for the Gutenberg-Richter frequency-magnitude law. The idea requires that the seismotectonic regionalization be carried out at several scales, using a morpho-structural zoning of the region, derived from the data on active faults of Trifonov and Machette (1993) and a general map of major lineaments. The Ground Motion Attenuation Model of Caputo and Molchan was used, valid for medium soils and normal-depth earthquakes. For the computation they used a special version of the universal algorithm by Keilis-Borok et al. (1973), developed to assess economic and other risks related to earthquake hazard. Figure 9 displays areas with expected shaking of intensity I³ VI, VII, VIII, IX with a return period of 475 years.
Seismic Hazard Assessment: Deterministic approach (IG/GAS, Georgia)
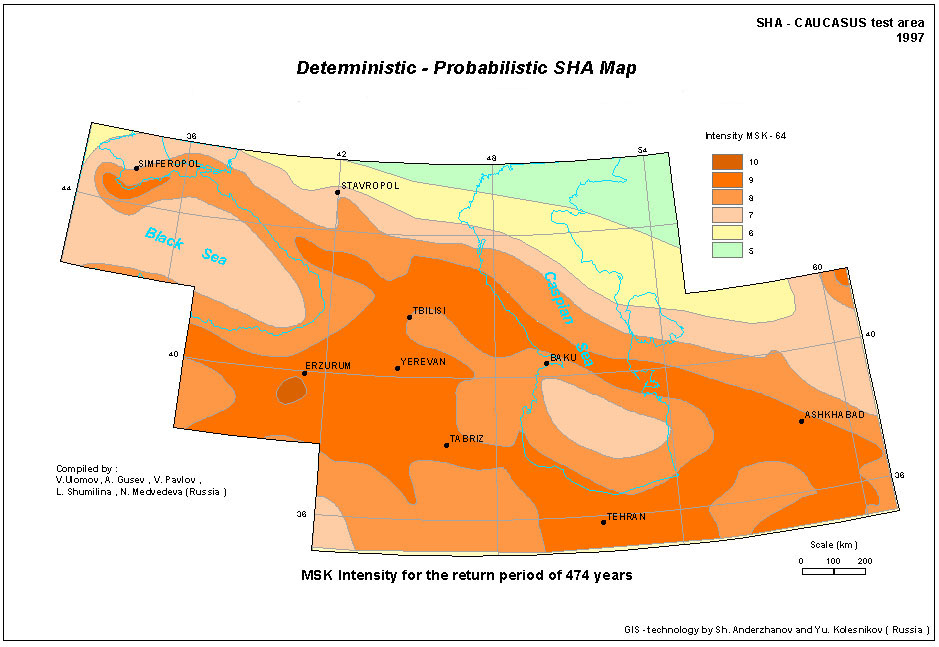
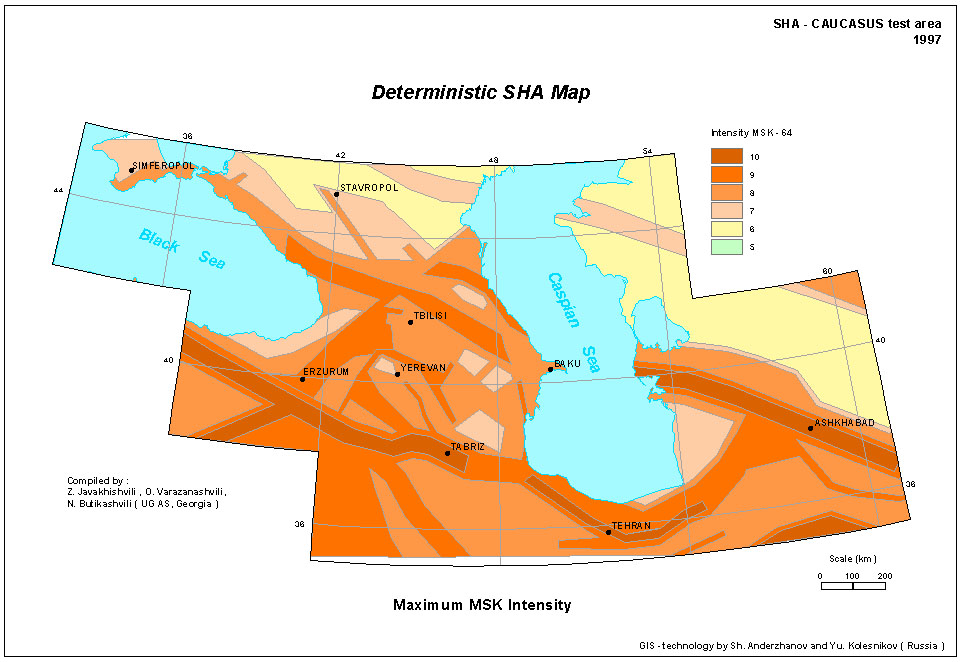
The deterministic map of seismic hazard was compiled by Z. Javakhishvili, O. Varazanashvili, N. Butikashvili under the leadership of Z. Javakhishvili. Maximum expected intensities (MSK) are shown in Figure 10. The map has been compiled on the basis of the map of Seismic Source Zones of the Caucasus test area, which, in its turn, was based on the map of the lineament model of SSZs. The transition from the map of SSZs to the deterministic map of seismic hazard was implemented on the basis of the generalized elliptic models of isoseismals.
Seismic Hazard Assessment: Probabilistic approach (IG/GAS, Georgia)
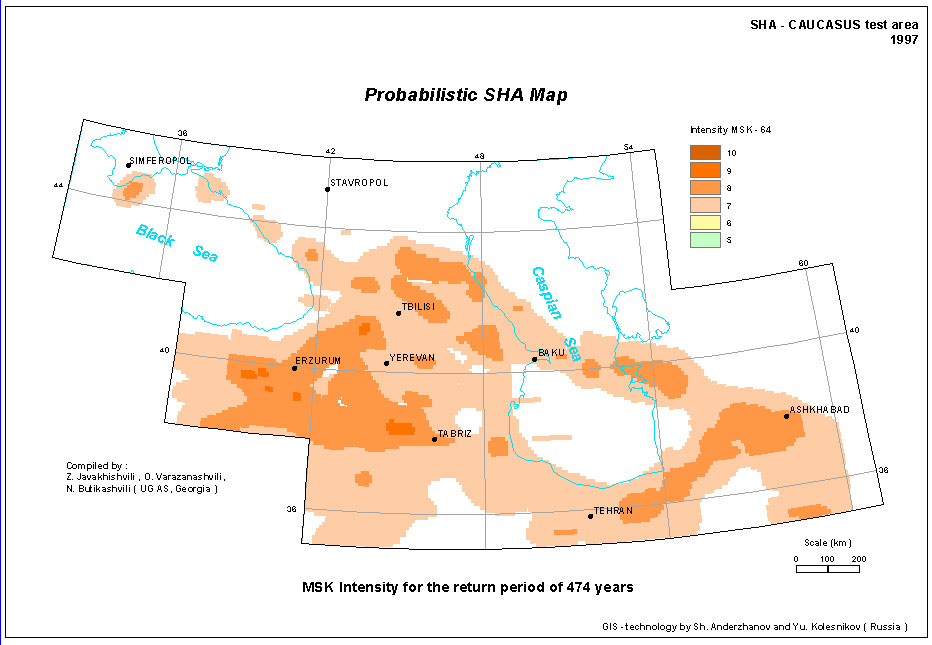
A second generation of probabilistic hazard was compiled by Z. Javakhishvili, O. Varazanashvili and N. Butikashvili, under the leadership of Z. Javakhishvili. The map compiles a probabilistic measure of seismic hazard, expressed as the long-term mean frequency of eismic shaking expected at a given location from all sources of earthquakes occurred in the surrounding area. The map is based on the SSZs model and on a map of seismic activity which actually presents areal variations of the levels of the recurrence plots. For the calculation of ground motion, the mean depth of the seismogenic layer was taken as H=10 km and an intensity attenuation law with distance in the form of Shebalins formula was used. The probabilistic map of seismic hazard is expressed in intensity isolines at fixed ground motion values for a recurrence period of T=475 years; zones with intensity I³ VII and VIII (MSK) and individual areas with I³ IX are marked in Figure 11.
Seismic Hazard Assessment: Historical-Probabilistic approach (IG/GAS, Georgia)
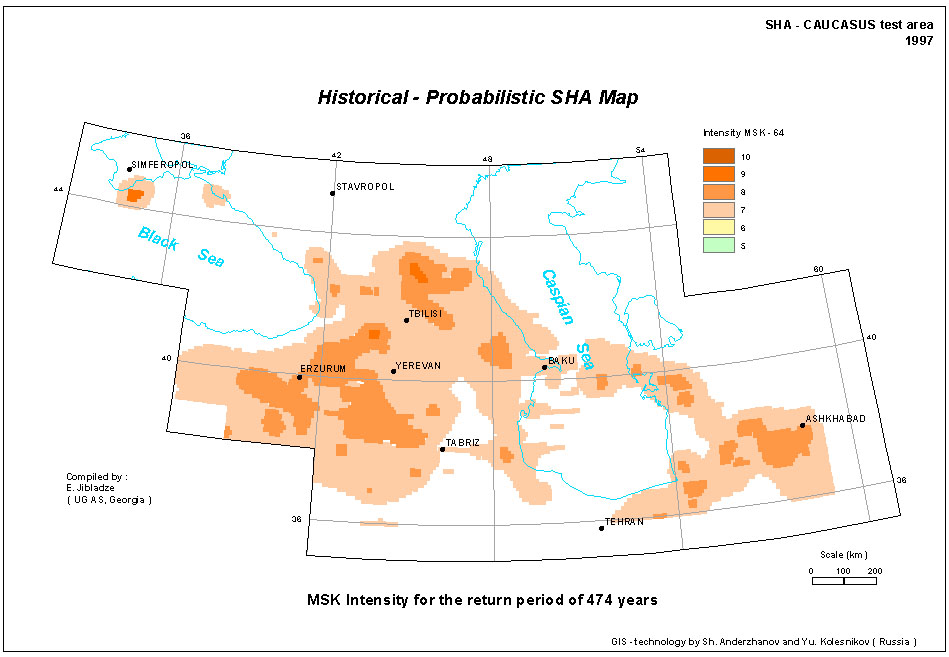
The historical-probabilistic
map of seismic hazard has been compiled by E. Jibladze and N. Butikashvili,
using as input the frequency/size distribution from the SCETAC catalogue,
the magnitude-dependence of the energy class by Rautian, the macroseismic
field parametrization by Blake and Shebalin, the dependence between preparation
area and earthquake size (according to Riznichenko and Jibladze), the hazard
formulation of Cornell and the ground motion equation by Riznichenko (1965).
Seismic hazard was compiled for a return period of T=475 years and a waiting
time of t=50 years, and expressed in terms of macroseismic intensity (Figure
12).
COMPATIBILITY OF
DIFFERENT SHA METHODOLOGIES
The different models of seismic hazard assessment obtained by different groups for the CAUCAS test area were summarised. These can be compared by three characteristics:
1) Seismotectonic-Probabilistic, Deterministic-Probabilistic. The maps of the first group, especially the versions shown in Figures 6 and 8, characterize the seismic hazard in the region mostly as quite high mostly, with peak acceleration in the 0.3-0.5 g range (Figure 6) and I=9-10 MSK (Figure 8). Both maps are well compatible with the observed strong seismic events in Figure 3 and the known active structures Figure 4.
2) Areal-Probabilistic, Probabilistic, Historical-Probabilistic. The second group of methods shows quite similar results (the areal method covers a smaller area) and depicts generally low hazard for the region (Figures 9, 11 and 12), with typical I=7 MSK high values for similar areas in the three maps. All three maps map well the location, but not the intensity, of observed past strong earthquakes (Figure 3), and do not reflect active seismotectonics (Figure 4) which is needed to produce future strong earthquakes.
3) Deterministic (Figure
10). The deterministic map is closer to the 1st group than to the 2nd one
both for maximum value of seismic hazard and the configuration of seismically
hazardous zones. However, the deterministic approach is quite far from
the 1st group of methods. Moreover, is some cases (most notably in the
area of the Spitak catastrophe, 1988, M=7.0) the deterministic approach
little conforms to the observed data.
CONCLUSIONS
The work implemented in the framework of the IASPEI-GSHAP-INTAS "Test Area for Seismic Hazard Assessment in the Caucasus" programme (INTAS Ct.94-1644) demonstrated the feasibility and importance of the GSHAP concept.
Acknowledgements
The authors are grateful
to all scientists from the countries of Western Europe, FSU, as well as
Iran and Turkey who took part in the implementation of this project. We
are also thankful to INTAS, GSHAP, NATO, IASPEI and all the other organizations
who provided the financial support at different stages of implementation,
under contracts INTAS Ct.94-1644 (Test Area for Seismic Hazard Assessment
in the Caucasus), NATO ARW Ct.95-1521 (Historical and prehistorical earthquakes
of the Caucasus), and other ad-hoc funding from IASPEI and ILP/GSHAP.
References
Cornell C.A. (1968): Engineering seismic risk analysis, Bull. Seis. Soc. Amer., 58, 1583-1906.
Giardini D. & S. Balassanian, "Historical and Prehistorical Earthquakes in the Caucasus", eds. D. Giardini and S. Balassanian, NATO ASI Series, vol 28, 545 pp, Kluwer Academic Pub.
Hanks, T. C. &
H. Kanamori (1997): A moment magnitude scale, J. Geophys. Res., 84, 2348-2350.
Joyner, W.B. &
D.M. Boore (1993): Methods of regression analysis of strong motion data,
Bull. Seism. Soc. Am., 83, 469-487.
Keilis-Borok, V. I., Kronrod, T. L. & G. M. Molchan (1973): Algorythm for the estimation of seismic risk, Comput. Seismol., 6, 1-44.
Kondorskaya N.V. & N.V. Shebalin (1982): New Catalogue of Strong Earthquakes of the USSR From Ancient Times Through 1977, World Data Center A, Colorado.
Rautian T. G. (1960): Easthquake Energy Transaction of JIPE, 9, 35-114.
Riznichenko Yu. V. (1965): From the activity of seismic sources to the intensity recurrence at the ground surface, Izv. AN SSSR, Fizika Zemli,11, 1-12 (in Russian).
Shebalin, N. V. & R. E., Tatevossian (1997): Catalogue of strong earthquakes (M>=6.0) for the Global Seismic Hazard Assessment Program: test area of Caucasus, in "Historical and Prehistorical Earthquakes in the Caucasus", eds. D. Giardini and S. Balassanian, NATO ASI Series, Kluwer Academic Pub., 1-32.
Trifonov, V.G. & M.N. Machette (1993): The world map of major active faults project, Annali di Geofisica, 36, 225-236.
Ulomov, V. (1999):
Seismic hazard assessment of Northern Eurasia, Annali Geofis., this volume.
Figure 1. Geographical and political map of the Caucasus-Kopetdagh region.
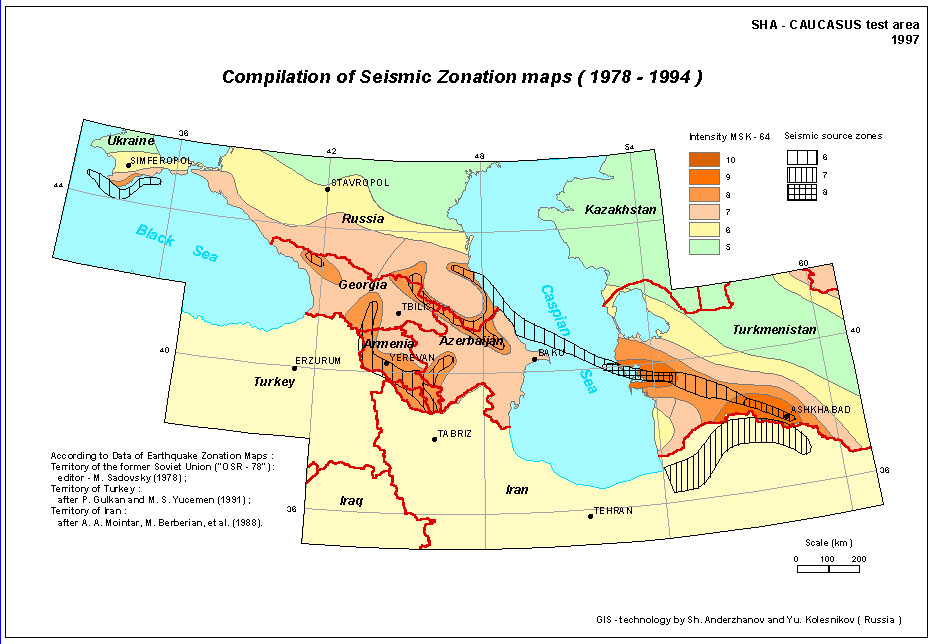
Figure 2. Compilation of existing seismic zonation maps in the Caucasus-Kopetdagh region before the start of this project.
Figure 3. Earthquake location from the SCETAC catalogue. Different symbols are plotted according to event size; for larger earthquakes the symbol scales with the event fault area (see legend and text).
Figure 4. Lineament model of Seismic Source Zones. The thickness of the lines decreases twice with each step of reduction of the magnitude value. Lineament source zones are classified, similarly to earthquakes, according to the maximum potential magnitude they are capable to generate (more details in text and in the legenda).
Figure 5. Seismic hazard map of the Caucasus Test Area computed using the seismotectonic probabilistic approach and adopting a 0.5 standard deviation to characterize the attenuation uncertainty. Peak ground acceleration expected with a 10% exceedance probability in 50 years (return period of 475 years) is displayed.
Figure 6. Seismic hazard map of the Caucasus Test Area computed using the seismotectonic probabilistic approach and adopting a 0.6 standard deviation to characterize the attenuation uncertainty. Peak ground acceleration expected with a 10% exceedance probability in 50 years (return period of 475 years) is displayed.
Figure 7. Lineament-Domain-Focal model (LDF-model), combining three main types of seismogenic structures: lineaments, domains and potential earthquake sources.
Figure 8. Seismic hazard map of the Caucasus Test Area computed using the deterministic-probabilistic approach on the basis of the Lineament-Domain-Focal model in Figure 7. MSK-64 intensity expected with a 10% exceedance probability in 50 years (return period of 475 years) is displayed.
Figure 9. Seismic hazard map of the Caucasus Test Area computed using the areal-probabilistic approach. MSK-64 intensity expected with a 10% exceedance probability in 50 years (return period of 475 years) is displayed.
Figure 10. Seismic hazard map of the Caucasus Test Area computed using the deterministic approach. Maximum expected MSK-64 intensity is displayed.
Figure 11. Seismic hazard map of the Caucasus Test Area computed using a probabilistic approach. MSK-64 intensity expected with a 10% exceedance probability in 50 years (return period of 475 years) is displayed.
Figure 12. Seismic hazard map of the Caucasus Test Area computed using the historical-probabilistic approach. MSK-64 intensity expected with a 10% exceedance probability in 50 years (return period of 475 years) is displayed.